forest-fire-forecast
Deployed a global fire-risk prediction into Ambee's proprietary API (Funded) 🔥
This page is the culmination of the work I did at Ambee (Summer ‘22) as a Data Science Intern.
- Created a global Forest-Fire Forecasting system (F3) to integrate into Ambee’s proprietary API dashboard, enabling comprehensive risk assessment.
- Developed modularized components implemented within an end-to-end ML lifecycle, ensuring continous forecast generation complimented by robust data pipelines. Automated satellite raster retrievel scripts and dockerized big data processing jobs from sources like VIIRS, MODIS, GOES, GMAO, GridMet, etc.
- Wrote custom scripts for scraping data off more than 16 satellites, from fire-risk data and vegetation to topography and global population density. Employed land tiling based on different map projections to concatenate a global data-store from 2012-2022. Many of them have been automated into their data lakes.
- Co-authored a research paper highlighting our extensive methodologies that uniquely leverage FWI data to classify world-wide geo-locations into appropritate risk levels. Notably, our models consistently achieve accuracies exceeding 90% across pertinent evaluation metrics for the North America Region, and have been validated against advanced weather-forecast-based ensembles.
The code and data (/sources) extracted from are considered proprietary, and hence cannot be shared. Below, I’m extracting images from our Paper (Jain, Ravikiran, et. al.), which analyzes our results for the North America region.
Understanding the ‘Why?’
Recent fire incidents have resulted in tragic loss of life, such as the Black Summer of 2019-2020 in Australia, where an estimated 33 people perished, and extensive damage to land and homes, with 18.6 million hectares consumed by flames (Parrott et al., 2021). In early 2021, wildfires ravaged approximately 7.13 million acres in the United States (Statista, 2022), while Algeria experienced a prolonged system of wildfires that took the lives of at least 70 people (Reuters, 2021). The financial toll is equally significant, with the 2018 California Camp Fire alone incurring losses exceeding $16.5 billion (Los Angeles Times, 2019).
These losses are primarily attributed to the destruction of residential and commercial structures, including homes, businesses, and infrastructure. The costs also encompassed expenses related to emergency response efforts, rehabilitation, and restoration of the affected areas. In the coming days, resources from all over the Western United States would be sent to Paradise to assist in the fight to contain the fire. In the aftermath of the wildfire, resources from across the Western United States were mobilized to support firefighting efforts in Paradise (Town of Paradise, n.d.). By November 10th, the response included a force of 5,596 firefighters, 622 engines, 75 water tenders, 101 fire crews, 103 bulldozers, and 24 helicopters working diligently to contain the fire (Town of Paradise, n.d.). These statistics highlight the urgent need for comprehensive fire risk forecasting and management strategies to protect lives, infrastructure, and ecosystems.
North American Region Overview
“During the winter months … fire activity is concentrated in the SouthWest and South areas. Spring, .. sees fire season expanding to cover the North, Central, and South West regions. As summer arrives … wildfire activity becomes prevalent in multiple regions, including the Northwest, South, Southwest, and East areas. Lastly, autumn … witnesses thefire season primarily concentrated in the Central region. Additionally, California … is now experiencing a year-round firerisk (Cart, 2022, para. 3). Presented below are visualizations of the fire climate regions in North America, depicting their spatial distribution and corresponding fire risk levels.” (Pg. 17)
Fire Weather Index (FWI) is a numeric rating of fire intensity. It is based on the ISI and the BUI, and is used as a general index of fire danger


We discuss some aspects of our gridded GMAO FWI data:

To account for year-wise patterns and shifts in fire risk, we employ two target encoding approaches: One-Shot encoding and Year-By-Year encoding of the ‘month’ feature across the ‘percentage’ features. These encoding methods are implemented within the timeframe of values utilized during model training in time-series-based folds to avoid data leakage.


Upon comparing the boxplots of One-Shot and Year-By-Year encoding methods, we observe that the distribution of month-encoded values for No Risk and Extreme Risk is similar, while Low Risk, Moderate Risk, and High-Risk values exhibit lower outliers in the One-Shot plot compared to the Year-By-Year plot. This difference is further highlighted by the smaller interquartile range in the Year-By-Year plot for the same three risk values.
The nature of the Year-By-Year encoding method becomes evident when considering a geo-location that incrementally experienced extreme fire risk over the month of July across different years. With Year-By-Year encoding, the risk level values assigned to the month of July vary based on previous years, capturing changes in the fire risk trend. In the early years, these values would be lower but would go on increasing sharply during the later years.
In contrast, the One-Shot encoding assigns the same values to the month of July across all years, potentially overlooking the historical changes in fire risk trends. Despite this, our results, discussed later on, showcase the good accuracy achieved by both encoding methods, indicating the overall season’s reliability in modeling fire risk historically.
Results
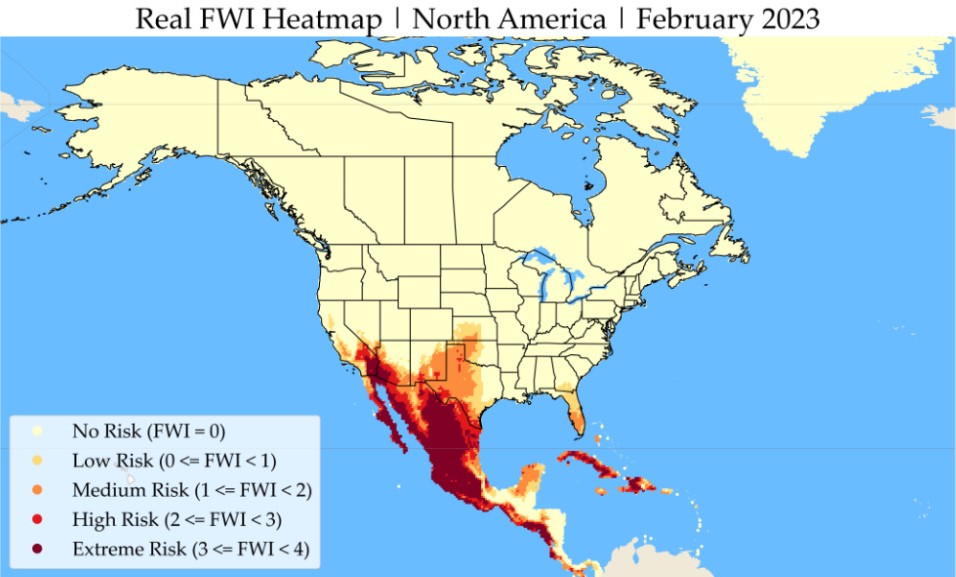
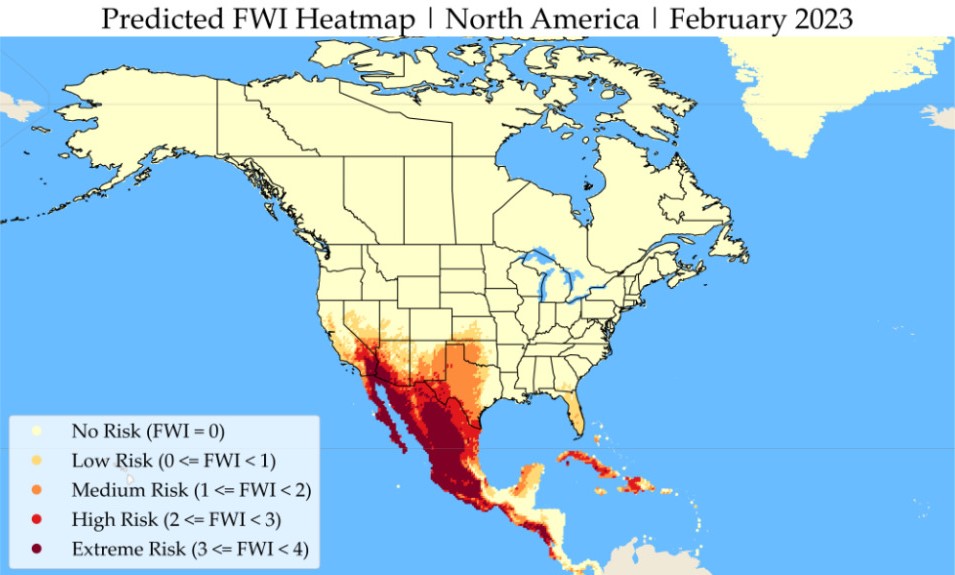
Here are how our results compare with the real FWI maps during 2022.


Talking Numbers!


Accuracy of 100% allows for difference of 1 level in risk-differentiation
Higher accuracies align with periods of minimal fire coverage, particularly noticeable during the early months of the year, when fire-prone coverage is low and increases rapidly in later months. Our model accurately distinguishes positive fire risk (High and Extreme) from negative fire risk (No and Low) during winter and spring seasons. Conversely, the model performs well in classifying positive fire risk during months with higher fire-prone coverage but struggles with negative fire risk. In conclusion, both models tend to overestimate fire risk during the Summer and Autumn seasons, while maintaining high accuracy in predicting high and extreme risk coverage throughout all months.

Furthermore, upon analyzing the two models - using One-Shot and Year-By-Year encoding methods - we observe distinct patterns in their importance attribution. The first model heavily emphasizes the ‘month_encoded’ risk levels for the next month, as expected, since it aims to predict the risk level for the subsequent period. Conversely, it assigns relatively less importance to the current month’s ‘month_encoded’ risk levels and overall risk ‘percentage’ levels.
An interesting thing to note is that the One-Shot model places a lower emphasis on the ‘geo’, ‘ECO_ID’, and ‘BIOME_NUM’ features, which can be interpreted as the model’s ability to generalize over the entire region, regardless of the fuel type and land over, while focusing purely on the historical nature of the data.
On the other hand, the second model also prioritizes the ‘month_encoded’ values for the next month, while also placing greater importance on the ‘Extreme Risk’ encoded values. Interestingly, it attributes a comparatively higher significance to the ‘No Risk’ and ‘Extreme Risk’ values for both the current month’s ‘month_encoded’ risk levels and risk ‘percentage’ levels. This observation could be attributed to the consistent prevalence of ‘No Risk’ levels across a significant portion of the North American region throughout the entire training data period.
But, the important observation here is the ability of the model to prioritize the ‘Extreme Risk’ level more, since the areas which generally have an extreme fire risk have consistently high ‘month_encoded’ values for the same.
Overall, both models demonstrate a common focus on predicting the risk level for the next month, while accounting for the unique characteristics of the North American Region.
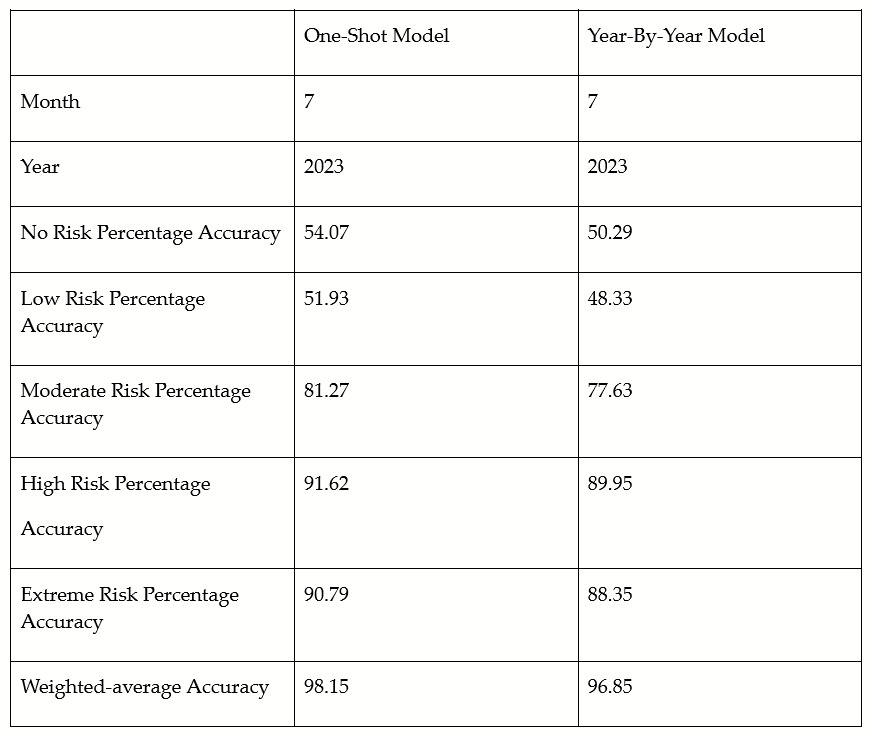
In order to showcase the accuracy and performance of our fire risk prediction models, as a whole, we consider a real-life example of how these models would be used. First, we trained the model using data up to May 2023 only. Subsequently, we put the model to the test by predicting fire risk values for the next two months, June and July, of the same year. By comparing these predictions with the actual fire risk values observed to date, we have generated the following accuracy comparison plots and tables.

Our test comparing the prediction of real-time July 2023 data with both the One-Shot and Year-By-Year models revealed compelling insights. The One-Shot model outperformed the Year-By-Year model across all aspects, demonstrating its superior predictive capabilities. In the feature importances analysis of both models, we observed that the One-Shot model exhibited better generalization over the entire North American region.
Ambee vs. Govt Forecats
CWFIS: Canadian Wildland Fire Information System


For the July forecast comparisons, both models identify an area of increased risk around the Great Salt Lake in the Northwest Territories. Additionally, both forecasts indicate elevated fire risk areas across the provinces of British Columbia, Alberta, and Saskatchewan. Ontario and Quebec show comparable regions of No Risk to Low Risk.
In Yukon and Northwest Territories, similar-shaped spaces of Moderate to High risk are identified. Coming to the August forecast comparisons, we can clearly see identical High Risk to Extreme Risk areas covering British Columbia, Alberta, and Saskatchewan.
The upper parts of the same states have a comparatively lower risk but still show the presence of fire occurrence in both forecasts. Here, we see Quebec having almost No Risk throughout August, as is predicted by our models as well. We can also see hotspots of increased risk around the Great Slave Lake that match the predictions made by the Canada forecast models.
Notably, the Canada forecasts are generated by an ensemble of weather prediction models by the Canadian Centre for Climate Modelling and Analysis (CCCMA) and the Canadian Meteorological Centre (CMC). In contrast, our models solely rely on historical FWI data. Despite this distinction, our models maintain a high level of accuracy in comparison to the weather-based models, reinforcing the robustness of our approach.
NIFC: National Interagency Fire Center


In July, the forecasted fire risk due to weather aggravates in regions such as Washington, Oregon, Arizona, and parts of Texas, aligning with the summer season for North-West, South-West, and North America. Conversely, we found that the fire risk reduces in Arizona and some parts of Texas in August. Notably, the central region of California exhibits lower risk compared to its surrounding areas, a trend also evident in our model’s plots.
To gain deeper insights, we compared our plots for July and August, focusing on areas of significant change and cross-referencing with the NIFC August relative fire outlook. We observed that in Washington and Oregon, there is a greater extreme risk outlook from July to August, corroborated by the NIFC August plot.
Similarly, the extent of the green area in California decreases from July to August, reflecting the findings in our plots. Noteworthy regions with greater fire outlook include parts of Utah and Arizona. In New Mexico, our model places the region at moderate risk for both months, consistent with the relative NIFC plots.
These consistent and validated observations reinforce the high accuracy and reliability of our model’s fire risk predictions when compared to the widely recognized NIFC agency’s forecast maps for the United States.
Conclusion
The next steps forward involve integrating forecasted weather data, along with crucial factors such as drought, lightning, and extreme weather events, to create a more comprehensive and robust predictive model. Incorporating forecasted weather data into the existing models would allow us to account for the dynamic nature of wildfire risk, capturing how weather conditions may influence fire behavior over time.